Market Structure
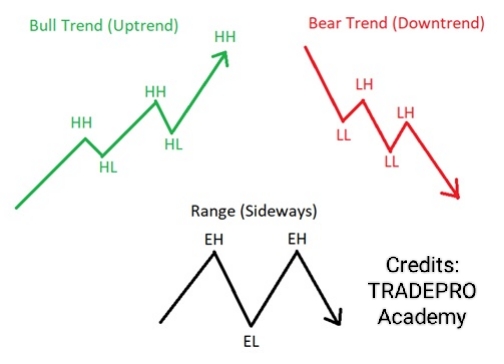
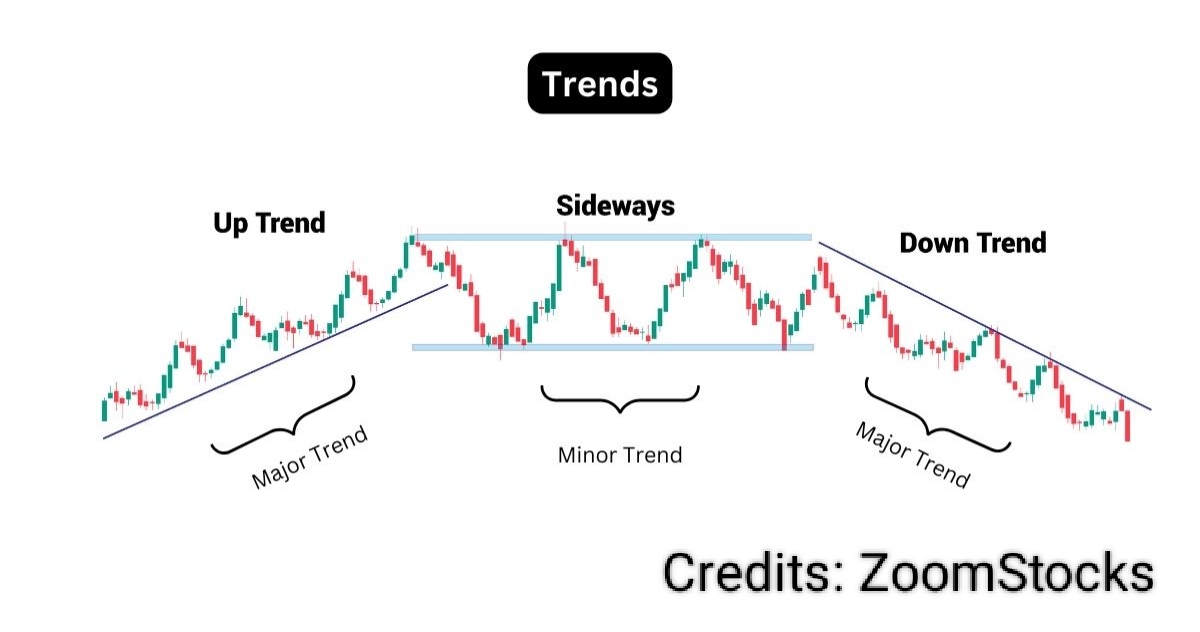
Market structure is the overall framework or pattern formed by price movements over time. It describe sequential between swing highs and swing lows, revealing the direction, strengths and potential turning points of a market. While support and resistance key levels,market structures shows how the market is moving, whether it is trending upward, downward, or moving sideways. It is considered the most reliable way to interpret price action and forms the basis for almost all technical analysis strategies.
Definition
Market structures refers to the arrangement of consecutive highs and lows on a price chart. It reflects the balance between supply and demand, as well as the psychology and behavior of all market participants. By identifying how these highs and lows form, traders can determine the current trend, spot potential reversals, and plan trades with higher probability.
Primary Market Trends
Bull Trend(Uptrend)
A Bull Trend occurs when the market is optimistic, and prices are rising. It is characterized by a series of:
A. HH(Higher Highs): Each successive peak is higher than the previous ones.
B. HL(Higher Lows): Each successive dip stays above the previous low.
Meaning: Buying pressure is stronger than selling pressure, the market is bullish.
Rule: As long as pattern continues, the trends remains up.
Bear Trend(Downtrend)
A Bear Trend indicates a pessimistic market while prices are falling. It is defined a series of:
A. LH(Lower Highs): Each peak fails to reach the level of the previous peak.
B. LL(Lower Lows): Each successive dip drops below the previous low.
Meaning: Selling pressure is stronger than buying pressure, the market is bearish.
Rule: As long as pattern continues, the trends remains down.
Range(Sideways)
A Range (or consolidation)occurs when the market lacks a clear direction. Price moves within a horizontal corridor, marked by:
A. EH(Equal Highs): Price peaks at roughly the same resistance level.
B. EL(Equal Lows): Price bounces off roughly the same support level.
Price moves horizontally between a clear support floor and resistance ceiling.
No clear direction; supply and demand are roughly balanced
Meaning: Market is consolidating, gathering momentum before the next major move.