Candlesticks
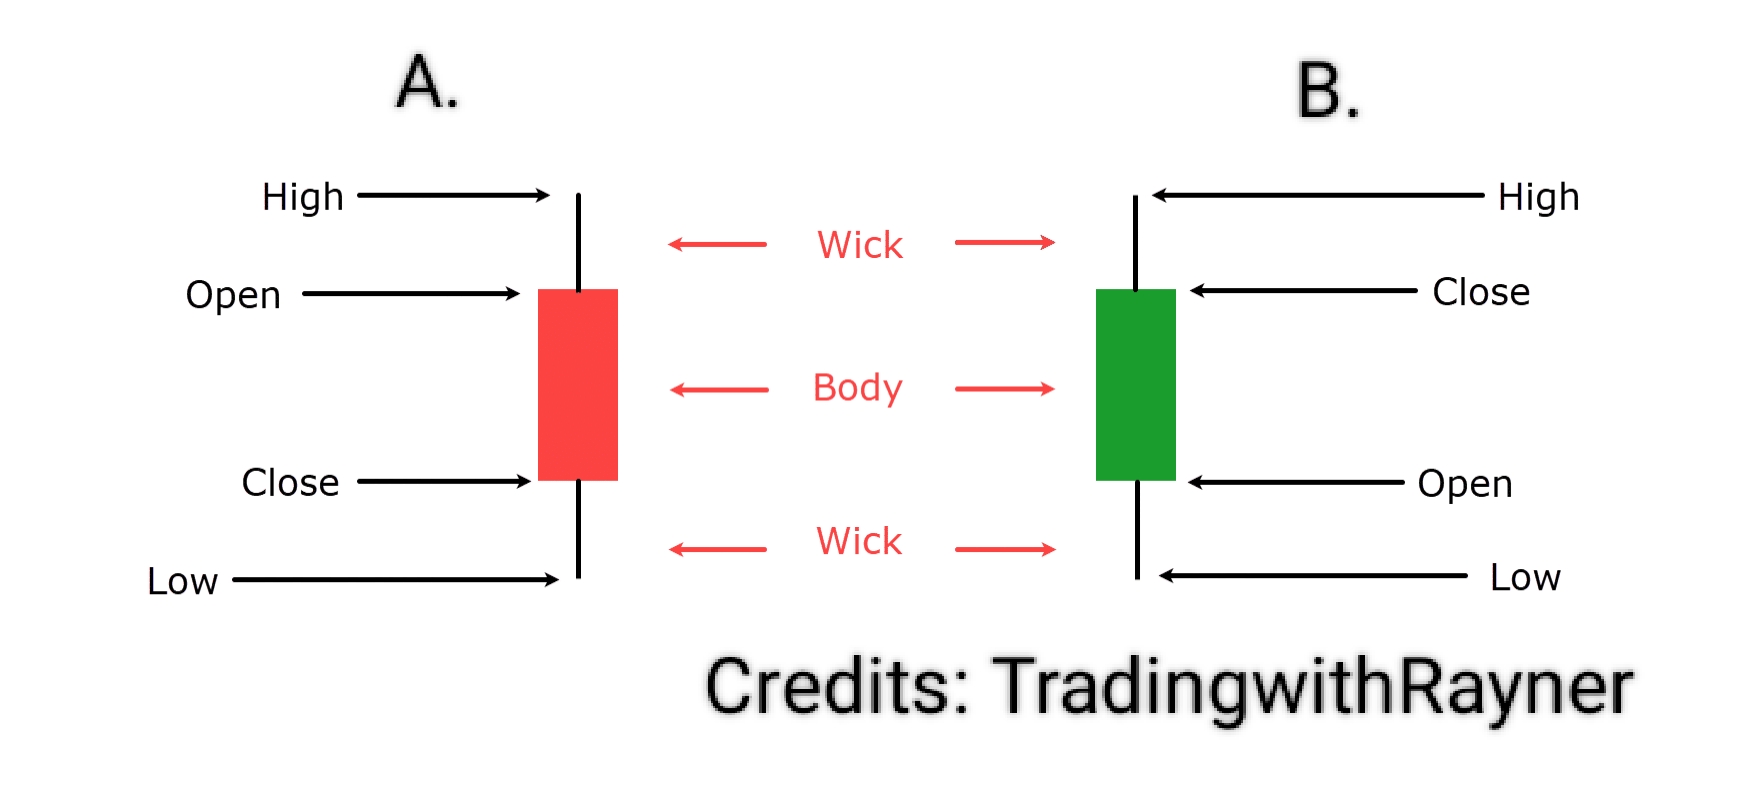
Bullish candlesticks is a chart pattern that signals buyers are stronger than the sellers. It tells the price is going up.(As shown in the image B)
Bearish candlesticks is a chart pattern that signals sellers are stronger than the buyers. It tells the price is going down.(As shown in the image A)
OPEN is the start of the candlesticks.
HIGH is the highest price of the candlesticks.
LOW is the lowest price of the candlesticks.
CLOSE is the end of the candlesticks.
Upper Wick represents the highest price reached during the candlestick's period but it was rejected by the market.
Body represents the price range between the opening and closing levels.
Lower Wick represents the lowest price reached during the candlestick's period but it was rejected by the market.
Types of Candlesticks
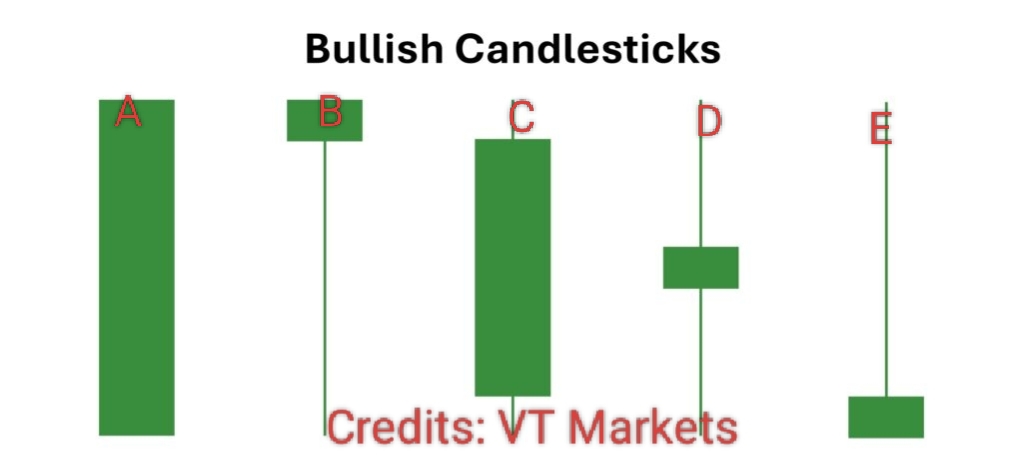
Bullish Momentum Candlesticks has long body with a very short or no wicks. It opens near the low(Lower Wick), closes near the high(Higher Wick) and signals strong buying pressure pushing the price upward(As shown A and C above)
Bullish Rejection Candlesticks has a long wick and a small body. It shows the price tested a key level but was strongly rejected, closing back near its opening level.(As shown B and E above)
Bullish Small Bodied Candlesticks forms when open and close is nearly identical. The market is undecided due to its small body.(As shown D above)
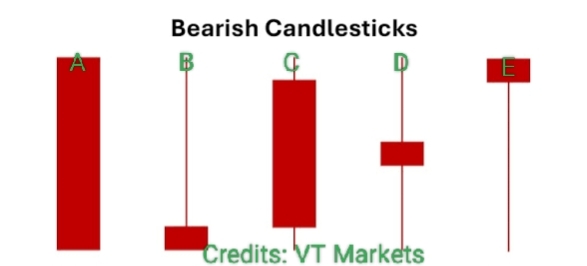
Bearish Momentum Candlesticks has long body with a very short or no wicks. It opens near the high(Higher Wick), closes near the low(Lower Wick) and signals strong buying pressure pulling the price downward(As shown A and C above)
Bearish Rejection Candlesticks has a long wick and a small body. It shows the price tested a key level but was strongly rejected, closing back near its opening level.(As shown B and E above)
Bearish Small Bodied Candlesticks forms when open and close is nearly identical. The market is undecided due to its small body.(As shown D above)
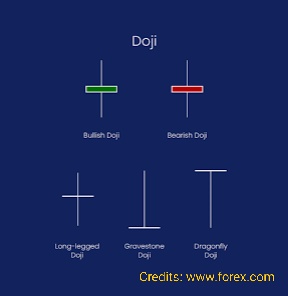
Bullish Doji are candlesticks that forms after a downtrend, signaling selling pressure is fading and buyers may take control- potential bullish signal.
Bearish Doji are candlesticks that forms after a uptrend, signaling buying pressure is fading and sellers may take control- potential bearish signal.
Long-legged Doji has long wicks and almost no body. It signals strong indecision, high volatility and the trend is likely losing strength
Gravestone Doji has a long upper wick almost no body and open/close/low all near the same level. It signals strong rejection of higher prices, buyer exhaustion and a potential bearish reversal.
Dragonfly Doji forms when sellers push price low, but buyers drag it right back to open. It shows rejection at support and warns of a likely bounce higher.
How to Use Candlesticks
Wait for Candlesticks to Complete: Do not enter yet. Wait the candlesticks to be complete.
Measure Sentiment: Long bodies and big volume=strong momentum; small bodies small volume=weak movement/indecision.
Confirm with Levels: Candlesticks work best when they appear at support, resistance or trendlines.
Timeframe Context: Patterns on higher timeframes(1 hour, 4 hour, daily) are far more reliable than than lower timeframes.
Combine tools: Use candlesticks alongside market structure, volume and support and resistance
Risk Management: Never rely only on candlesticks; always use stop-loss order.
Limitations
Subjectivity: Interpretation can vary slightly among traders.
False Signals: Candlesticks may appear but fail to deliver the expected move, especially in low liquidity.
Not Predictive: They reflect what has happened not guarantee future results.
Conclusions
Candlesticks are the "language" of price action. The turn raw price data into clear visual stories about the battle between buyers and sellers. When understood correctly and used in combination with market structure and support/resistance, candlesticks become a powerful tool to identify entry points, manage risk, and improve trading decisions across all financial markets.