
Cryptocurrency is a digital money that exists only online. It is not controlled by any banks, governments or companies. It uses blockchain technology- a public, secure record of all transaction. You can send, receive or invest it directly peer-to-peer, 24/7, anywhere in the world, fast.
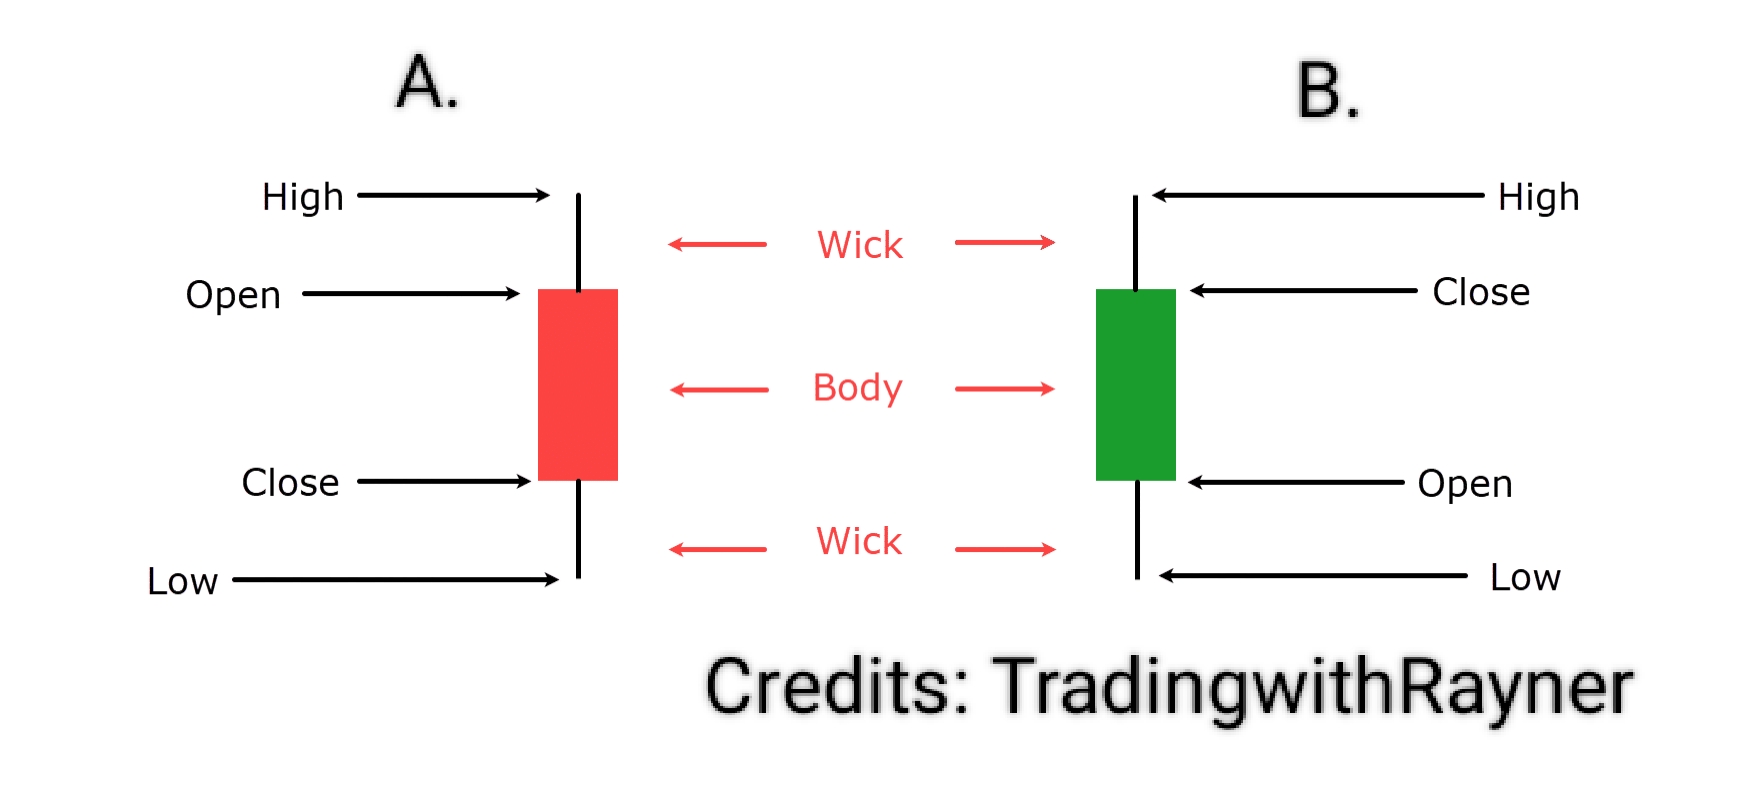
Candlesticks are the most common chart type of trading, price movement over time, tells you everything: open, close, high, low, who's winning(buyers or sellers).
1. OPEN: price at the START of the time period.
2. CLOSE: price at the END of the time period.
3. HIGH: highest price reached during that time.
4. LOW: lowest price reached during that time.
The Body (or Real Body) is the thick, rectangular part in the middle of every candlesticks. It shows the price ended.
Bullish or green candlesticks describes any signal, candle, or market condition that shows buyers are stronger than sellers or the price is moving or will move up.
Bearish or red candlesticks describes any signal, candle, or market condition that shows sellers are stronger than buyers or the price is moving or will move down.
The Wicks or shadow are a thin lines sticking out above and below the candlestick body. They are the second most important part, and their meaning is very simple: the wicks show the price tried to go but got rejected.
Momentum Candlesticks or Body Candlesticks are candles that show the speed, force, and strength of the price move.
Rejection Candlesticks or Wick Candlesticks means price tried to move up or down but was strongly pushed back the opposite ways. It shows buyers and sellers rejected that price level.
Doji or Indecision Candlesticks is a special candlestick where the OPEN price and the CLOSE price are almost exactly the same. It has NO REAL BODY(or a tiny thin line instead of a body) only wicks above and below.
Binance is the world largest exchange and i used it on trading.
Spot Trading is a type of trading we will be using.
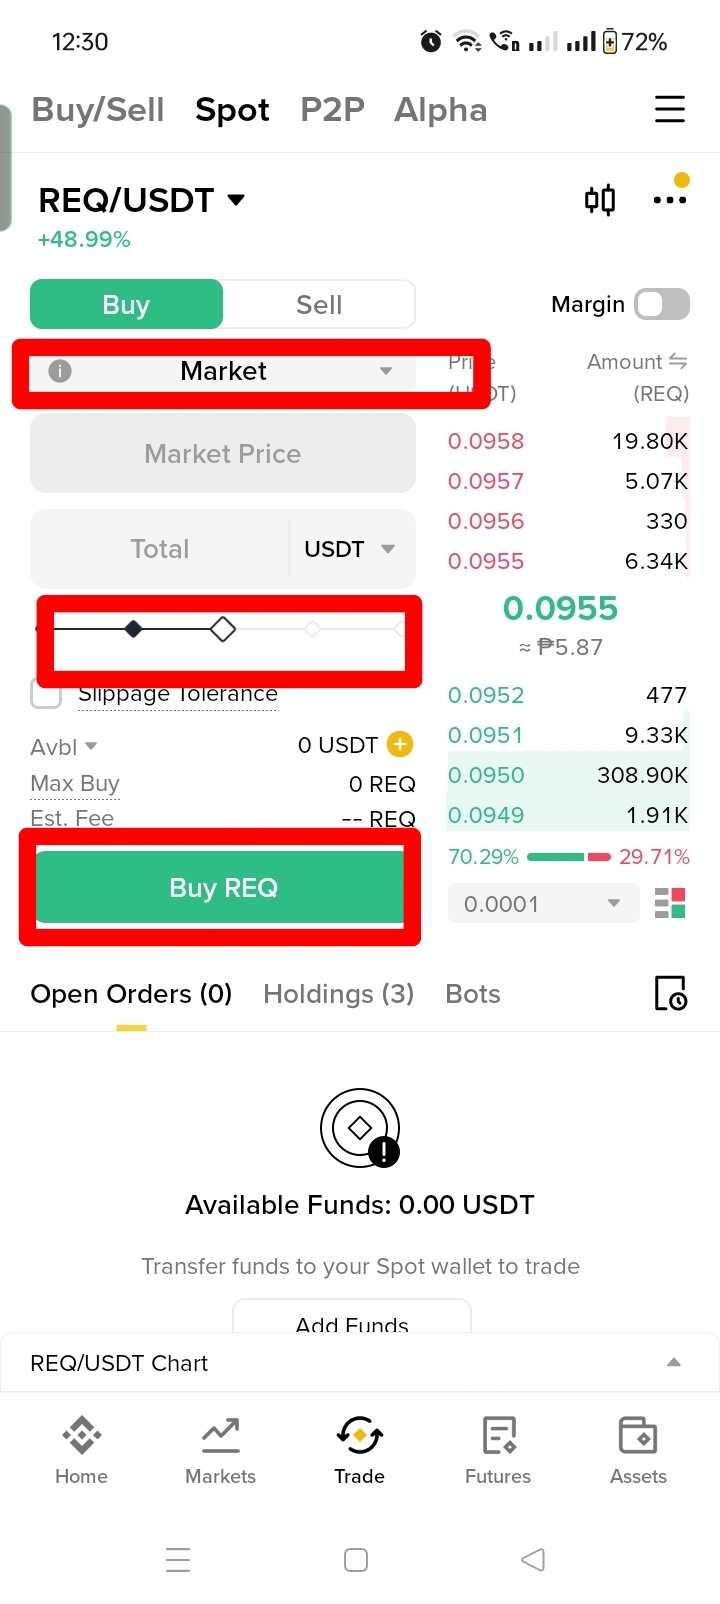
In my strategy we will be using market order only.
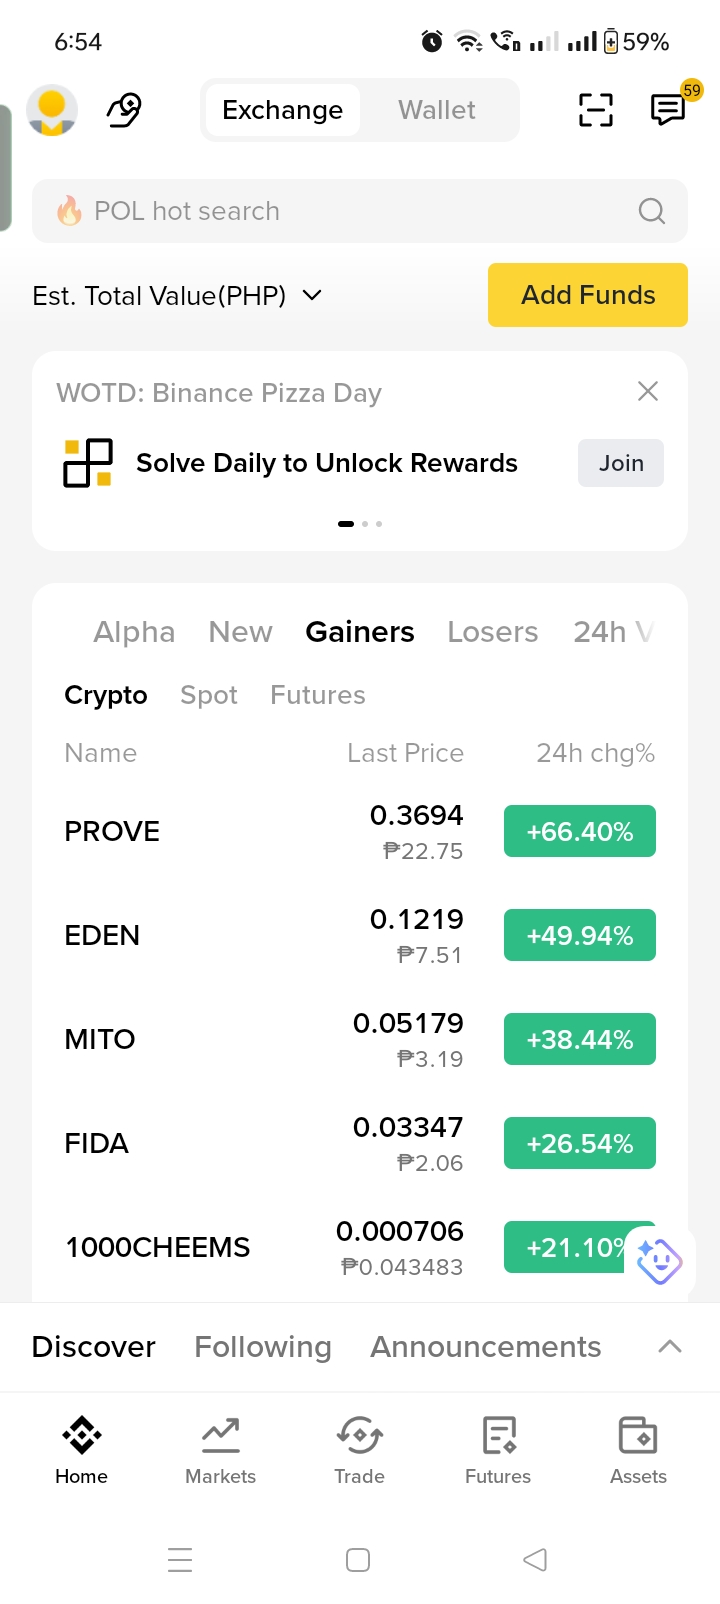
In the dashboard you will see Gainers. Gainers and Crypto is our tool to make our strategy better.
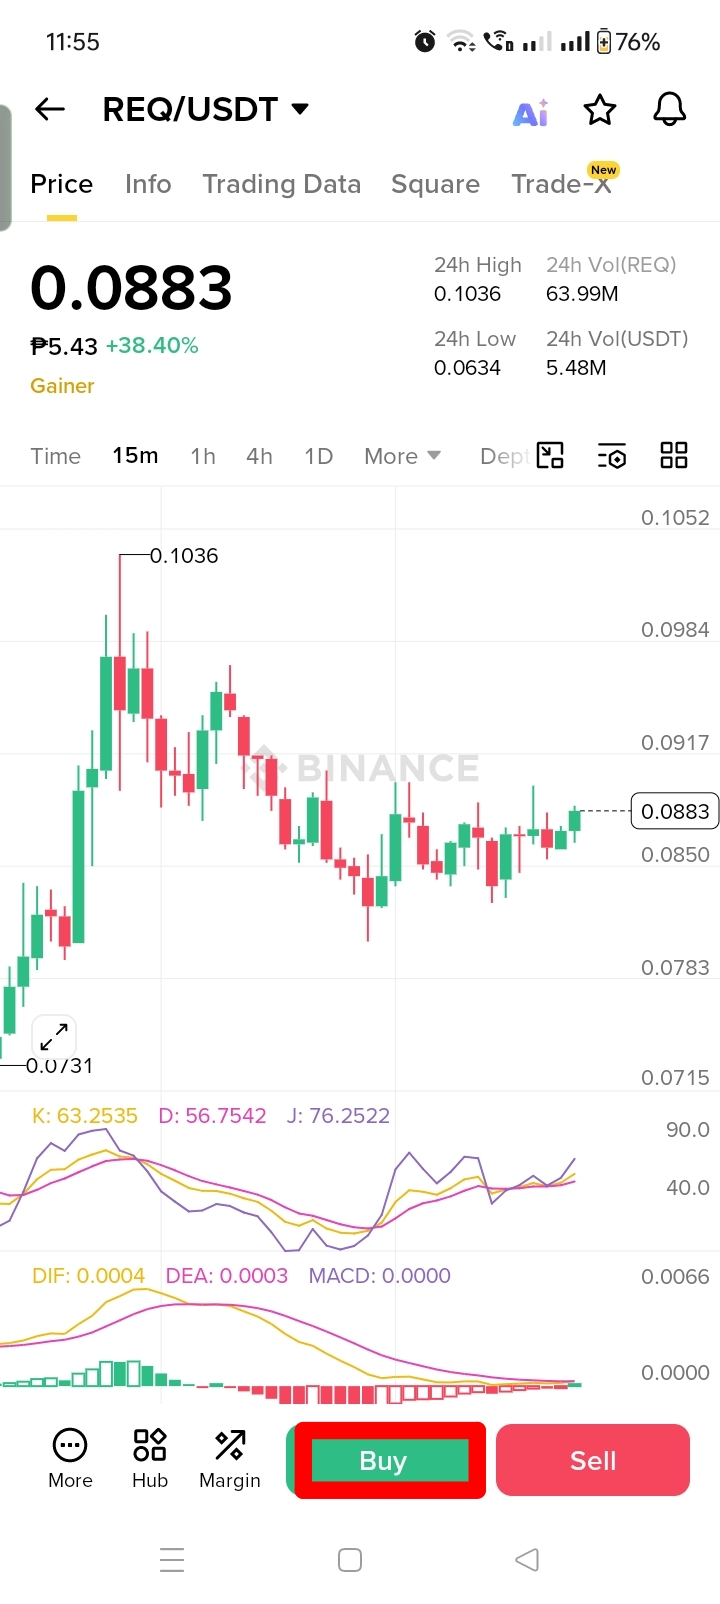
The timeframe we will be using is 15 minutes.
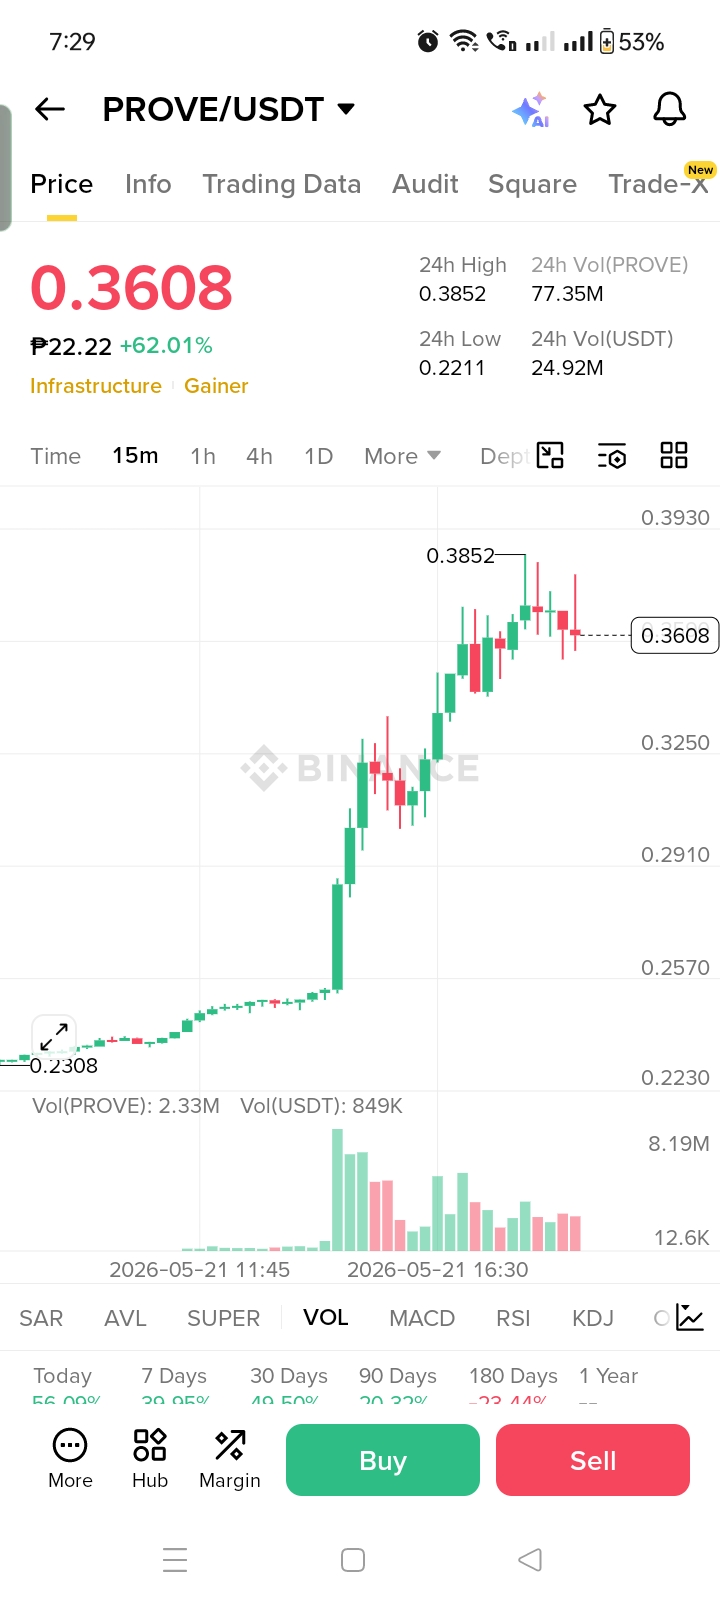
VOLUME Indicator or VOL is the total number of coins bought and sold.
If the coins has big volume and big green body candlesticks, i suggest dont trade cause it will go down.
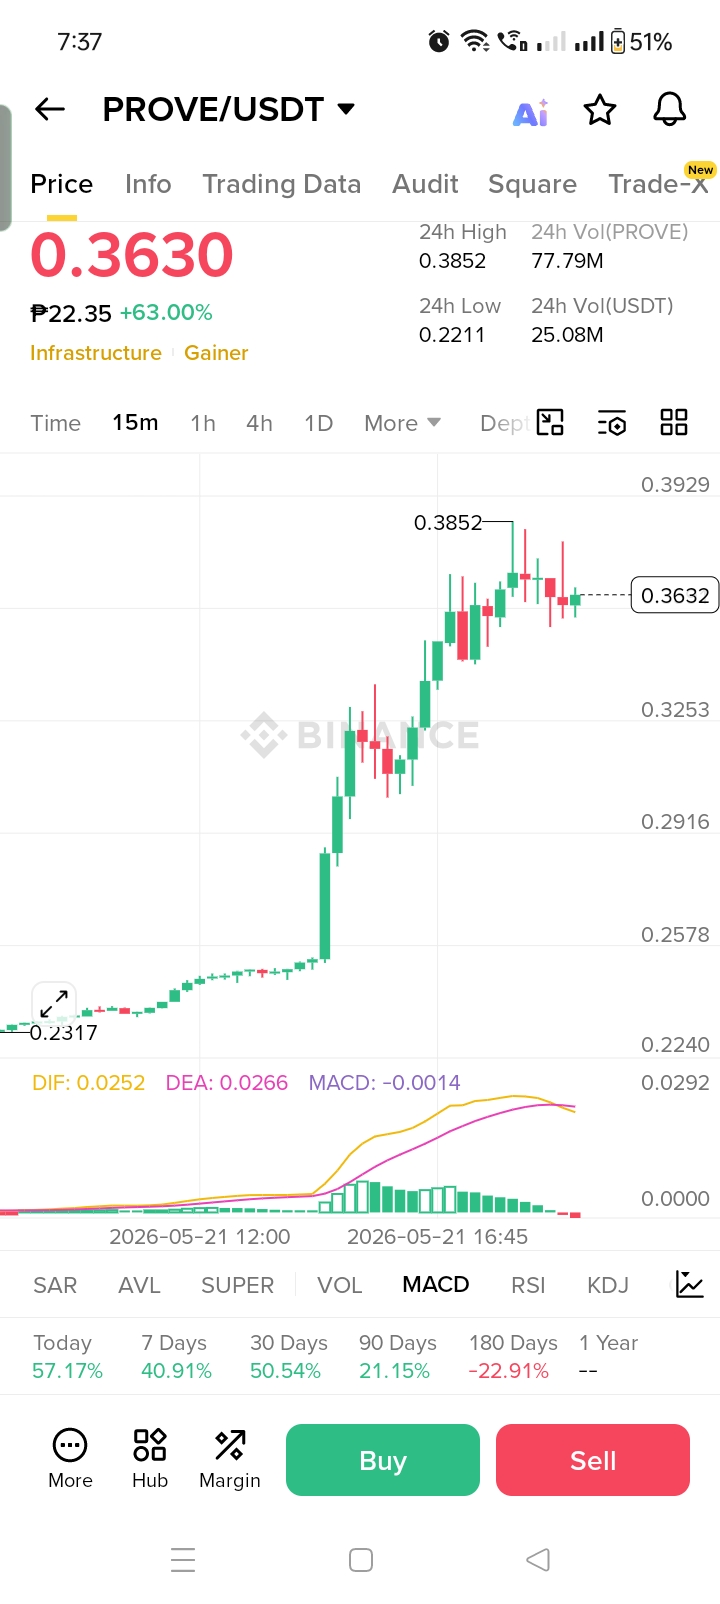
MACD Moving Average Convergence Divergence shows the relationship between two moving averages(MA) of a security's price.
It has 3 main parts
MACD Line or DIF (yellow line)
Signal line or DEA(pink line)
Histogram (the bars between them)
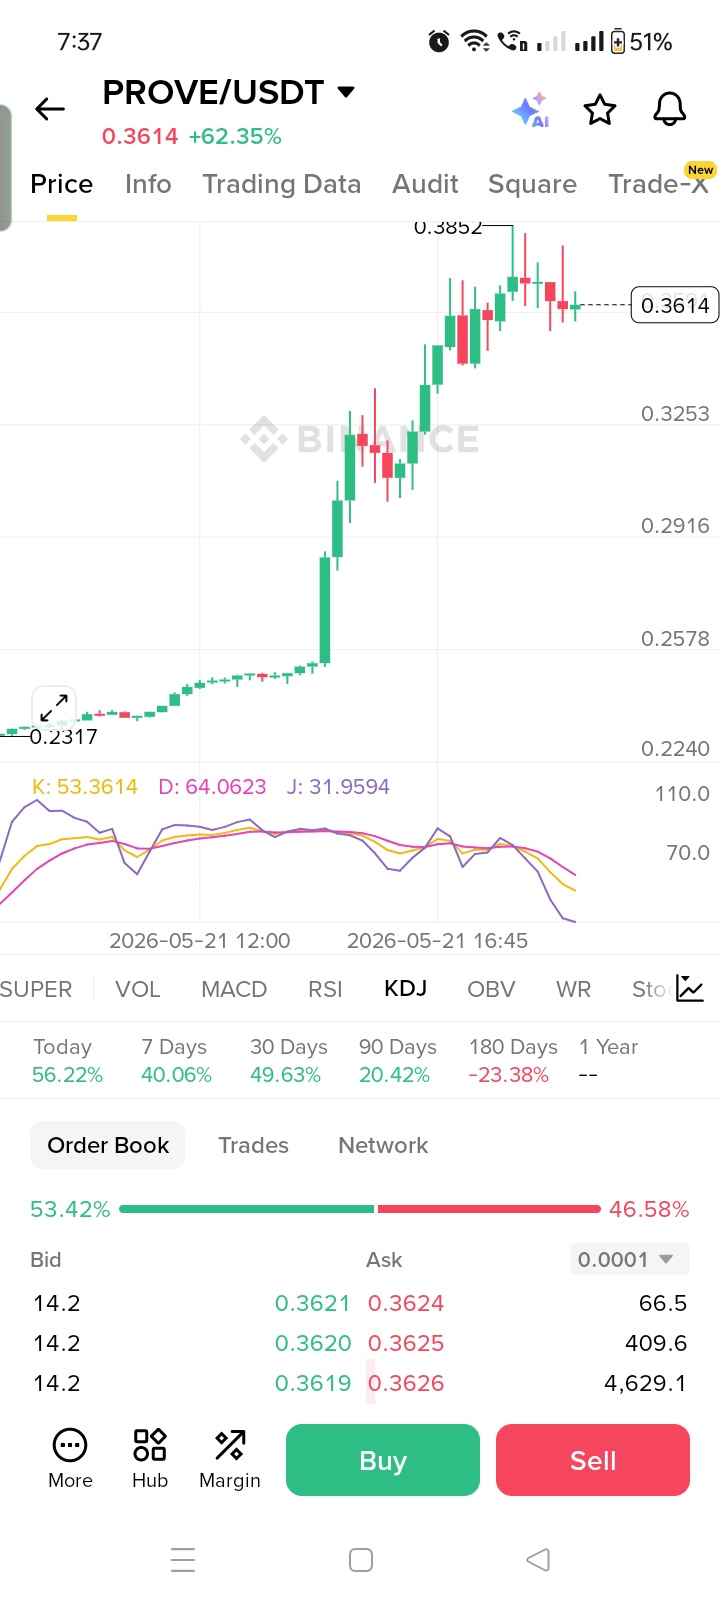
KDJ is a indicator that helps find overbought or oversold condition and trend directions.
It has 3 lines
K Line(fast line)
D Line(slow line)
J Line(fastest line most sensitive)
If the DEA on top intersect with DIF then the trend is bullish and vice versa.
If the histogram of MACD is green with white color and red with white color blocks then the trend is considered as bullish.
If the color of the histogram is pure green and red it will be bearish.
Take note that the safest entry should be in a small green and white blocks on MACD.
If the J Line below crosses above K Line and D Line it will be bullish.
If you are losing sell it quickly to avoid big loses.
Take note again if you will combine all technical indicator and you will be unstoppable.
Open Binance->Click Gainers->Click Crypto->Choose a Coin
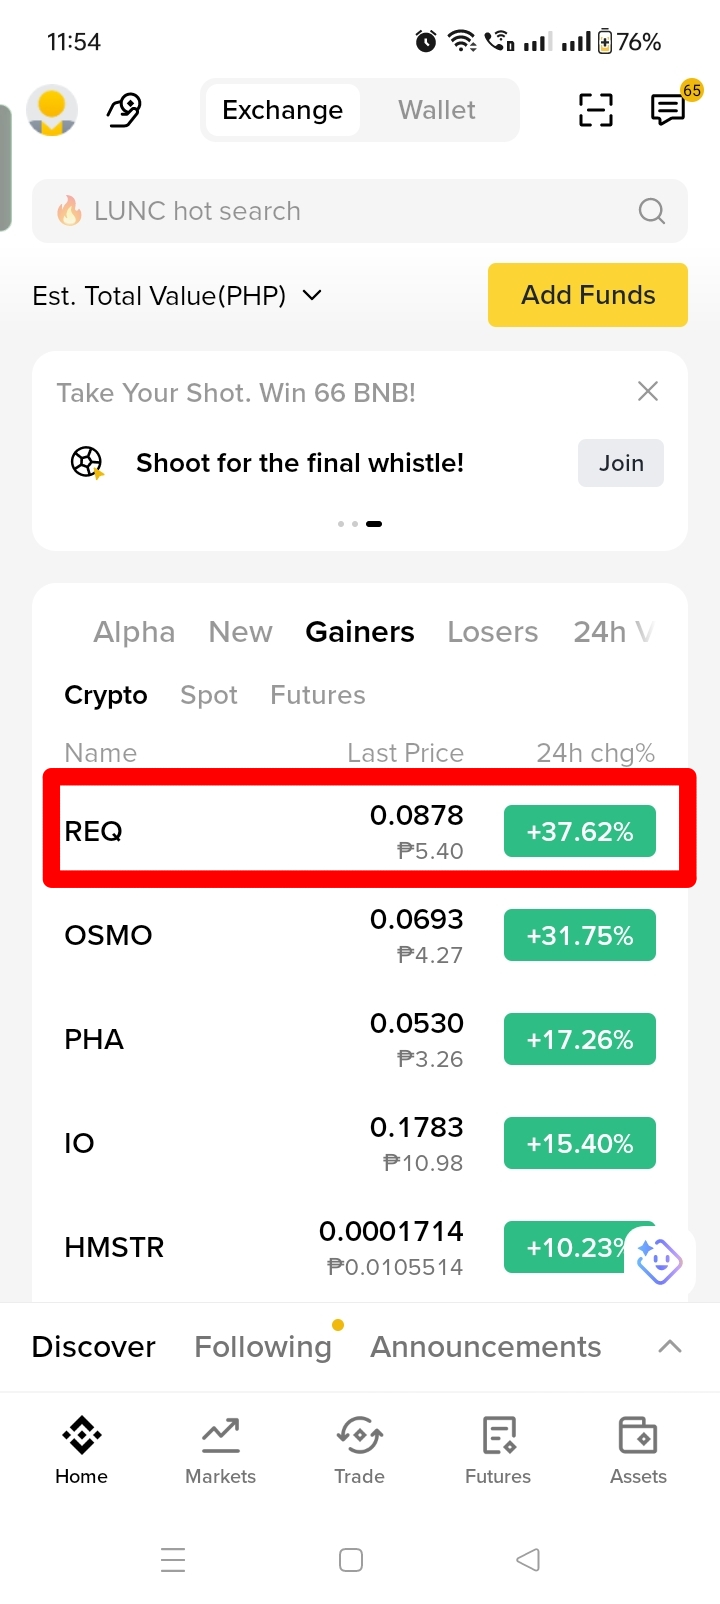
I choose "REQ" as my coin->Click "Buy"
Choose Market Order->Move the Line how many you want to Bet so I picked 50%->Click "Buy REQ"
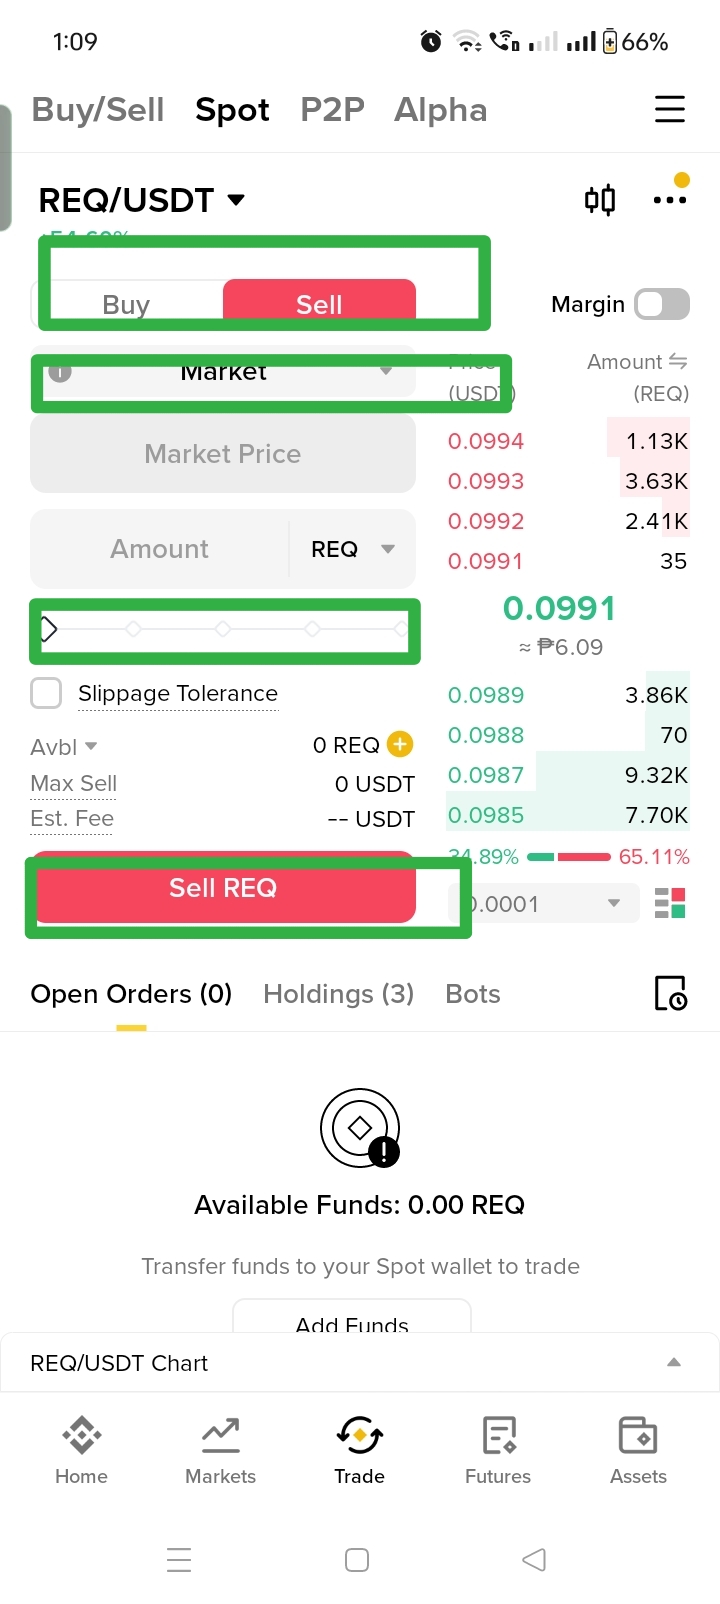
If I made a profit or losing then we will sell it follow this steps.
Click "Sell"->Choose "Market Order"->Scroll left to right to sell your bet->Click "Sell REQ"
 Home
Home